Module: Risk Management
Purpose: To provide insights into the risks under each risk level.
To Access: Risk Management - Library - Organisation Unit.
The Risk Heat Map is an overview of the distribution of risks according to the risk level across an organisation. It also allows you to interactively drill down to different levels of the organisation with direct links to the evaluation details of a risk.
You can choose to view the Inherent, Residual or Targeted Residual (residual risks after all proposed and agreed controls are implemented) risks:

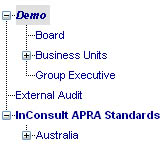
Select an organisation unit from the hierarchical organisation tree:

Note that when an organisation unit is selected, all the risks of the selected organisation unit and its children units will be included in the heat map unless the Include Children Organisation Units box is not ticked (which will then show only the risks attached to the selected organisation unit)..
![]() .
.
You may filter the risks by risk categories by selecting the desired risk categories from the dropdown lists:
![]()
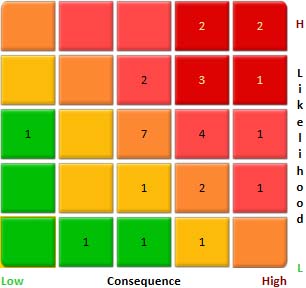
The risk concentration map shows the number of inherent or residual risks in each level of risk consequence and likelihood:

(The consequence and Likelihood levels are
expressed from one to five, one being the lowest and five being the
highest)
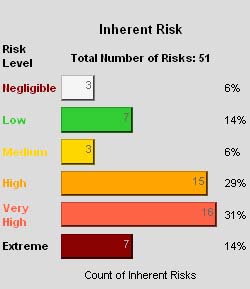
The distribution of the risks is also summarised in the risk level map:

When a cell in the risk concentration map is clicked, the name of the risks and the organisation units they attached to are shown in the bottom panel. You may view the details of the risk evaluation by clicking the Select button:

You can view the risks with high risk levels using the Top Risks filter.
![]()
Enter the number of top risks you would like to view and click the Go button.
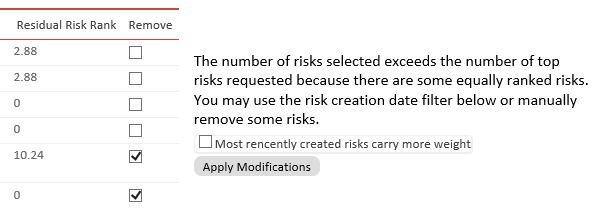
If a number of risks have the same rating such that the system comes up with more than the desired number of top risks, you may either tick the risks you want to remove from the list or assign more weight to the more recently created risks by ticking the "Most recently created risks carry more weight" box..

See also: